


Table of Content
Search “MBA finance project topics” and the same fifty ideas turn up everywhere - working capital management, mutual fund comparison, NPA analysis, a project on UPI because why not? Everyone has heard of UPI. The list gets copied over and over.
One topic gets picked on a Tuesday afternoon, and the report gets submitted eight weeks later. This process has produced so many identical projects that the year printed on the cover page is often the only thing that changes from one submission to the next.
The step almost everyone skips is checking whether the topic is actually backed by anything happening in the market right now. A topic can sound impressive on paper and still fall apart the moment a viva panel asks a simple question: what's the data source, and what does it show for the last two or three years? Guides that hand out fifty topics rarely survive that question, because the topics were never built from data in the first place, they were built by scanning what other guides already had, adding a couple of new ones, and calling it a list.
This piece is built the other way around. It starts with what changed in Indian finance recently, with numbers attached and sources named, and only then arrives at a topic worth defending in a room full of examiners. The intent here isn't to hand over another fifty options. It's to show how a small number of genuinely usable ones get identified, so the same method can be applied later to whatever specialisation the project eventually needs.
The filter nobody applies
Most guides ask students to pick a topic based on interest. Interest matters, but it belongs second in line, not first. The first filter is data availability, and it is where most projects quietly come apart. A student picks “impact of GST reforms on real estate demand” because it sounds current and relevant, then spends the next three weeks discovering that the specific data required either sits behind a paywall no library subscribes to or simply hasn't been published in a usable form yet.
Before a topic gets finalised, three checks are worth running. Does a regulator or industry body already publish usable data on it? RBI, SEBI, NPCI, and AMFI are the obvious starting points. Does that data stretch back three to five years, long enough to show a trend rather than a snapshot? And can a comparison be built into it, one bank against another, one fund category against another, one year against the next? A topic that fails any of these three checks tends to get written mostly in opinion rather than analysis, and examiners notice that difference fairly quickly.
Where the money actually moved in FY 2025-26
Two shifts in the data published this year stand out, and either one is strong enough to carry a full project on its own.
The first is UPI. Annual transaction volume grew from 2 crore in FY2016-17 to over 24,000 crore in FY2025-26, with the total value processed touching roughly ₹314 lakh crore, according to figures released by the Ministry of Finance through the Press Information Bureau in April 2026. The size of that number isn't the interesting part; everyone already knows UPI is large.
A smaller detail buried in the same data is more useful for a project: the combined market share held by PhonePe and Google Pay slipped below 80% for the first time in May 2026, as BHIM, Navi, and Super Money picked up ground. That single point opens an actual research question: what's driving the shift, and what does it mean for smaller players competing against a duopoly that no longer looks unbreakable?
The second shift sits in ESG (Environmental, Social, and Governance) investing, and it remains far less crowded as a project topic than UPI. Total AUM (Assets Under Management) across India's ESG-themed mutual funds moved from roughly ₹2,747 crore in early 2020 to somewhere between ₹9,700 crore and ₹11,000 crore by 2025, based on figures compiled by IBEF and reported separately by Wert Finserve.
SEBI's BRSR (Business Responsibility and Sustainability Reporting) framework now requires the top 1,000 listed companies to disclose sustainability data, with third-party assurance becoming mandatory from FY2024-25 onward. A project tracking fund performance against this regulatory timeline, before BRSR Core, after BRSR Core, comes with a built-in before-and-after structure, and that kind of structure tends to land well with panels because it doesn't need to be argued into existence. It can simply be shown.
Five directions worth building on
A handful of topic directions come out of this reasonably strong, mainly because current, citable data already exists behind each one.
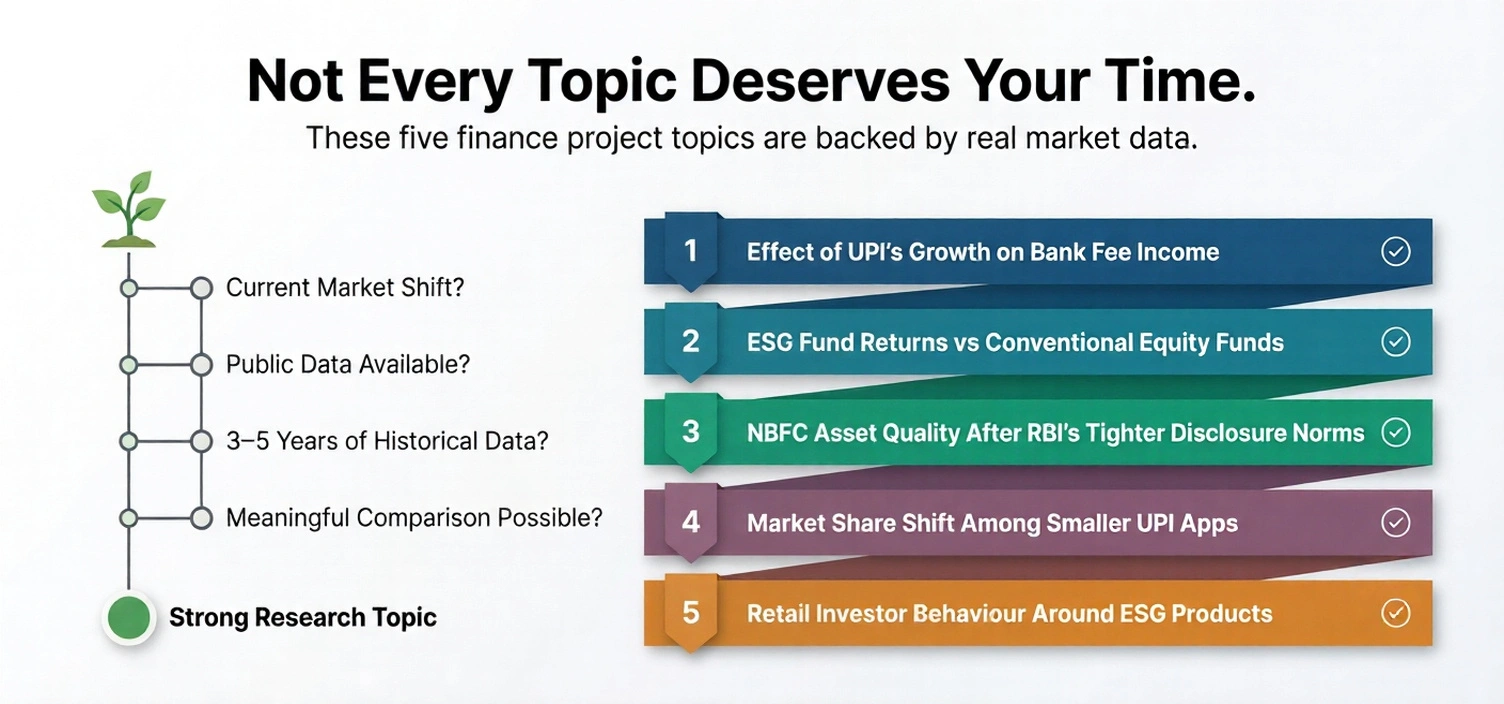
1. Effect of UPI's growth on bank fee income
This project tracks how the shift of person-to-merchant payments onto UPI has eaten into fee-based income for traditional banking channels like debit card usage, POS terminal charges, and IMPS fees using quarterly earnings disclosures from four or five listed banks over the last five years.
Expected outcome: A trend model showing which fee categories are shrinking fastest, and whether banks are offsetting the loss elsewhere, through subscription-based banking, lending fees, or cross-selling.
Why it matters: Bank profitability models built around transaction fees are being rewritten in real time. Treasury and product teams inside banks are already asking this exact question internally, which is what separates this from an academic exercise; the findings are usable the day the report is submitted.
2. ESG fund returns vs conventional equity funds
A comparative return analysis of eight to ten ESG-labelled mutual funds against matched conventional equity funds over a three-to-five-year window, benchmarked against the 18-22% CAGR some ESG funds have posted recently.
Expected outcome: A data-backed verdict on whether an "ESG premium," or penalty, actually shows up in the Indian market, and under what conditions it appears or disappears.
Why it matters: Fund houses and wealth advisors field this question from clients constantly, and there isn't yet a settled, India-specific answer. A well-built project closes a real information gap instead of restating a debate that developed markets settled years ago.
3. NBFC asset quality after RBI's tighter disclosure norms
A study comparing NBFC asset quality metrics like GNPA (Gross Non-Performing Assets), NNPA (Net Non-Performing Assets) and provisioning coverage before and after RBI's tighter disclosure norms, across a sample of five or six listed NBFCs.
Expected outcome: A dataset showing whether the new norms actually moved reported numbers, or whether the better NBFCs were already reporting close to that standard.
Why it matters: Credit rating agencies, lenders to NBFCs, and regulators are all watching this transition closely. NBFC stress has historically surfaced in credit data months before it becomes a headline event, which gives early-warning research like this direct relevance to lending decisions.
4. Market share shift among smaller UPI apps
A project examining what's driving the shift as BHIM, Navi, and other smaller apps gain ground while PhonePe and Google Pay's combined share slips below 80%, using NPCI's published monthly data.
Expected outcome: A ranked set of factors like cashback structures, banking partnerships, regional targeting and government push tested against the actual monthly trend rather than assumed from headlines.
Why it matters: This is a live market-structure question with real stakes for fintech investors and product teams. Understanding why a near-duopoly is cracking open has direct strategic value for any smaller player deciding where to compete next.
5. Retail investor behaviour around ESG-labelled products
A behavioural study testing whether retail investors kept holding ESG-labelled funds during periods when ESG stocks underperformed the broader market, using fund flow data as a proxy for investor conviction.
Expected outcome: Evidence for whether ESG investing in India is return-driven or label-driven, visible through redemption patterns during underperformance windows.
Why it matters: This highlights a major concern for SEBI and fund houses: the true sustainability of ESG inflows. When investors buy into the label rather than genuine conviction, they tend to pull their money out the moment returns falter.
These selections are intentionally grounded in standard sectors. What sets them apart from typical internet lists is their regulatory backing, featuring a multi-year data trail that surface-level articles routinely ignore. While selecting an option still requires substantial work, such as extracting filings, creating comparison tables, and analysing data, the foundational raw material is publicly available and ready to use.
The part most guides never mention: structure
A well-chosen topic can still collapse in a report with no spine. The sections an examiner actually reads closely are the methodology such as what data was used, over what period, and why that period; the analysis which is not a summary of news articles, but an actual comparison, before and after, this bank against that bank, this year against last; and the limitations section, which most students skip entirely because admitting a project has boundaries feels like a weakness. It's the opposite. A properly written limitations section signals that the data was genuinely examined, not just collected and pasted into a template.
Before committing
Fifty topics exist because fifty students needed one by Friday. Five hold up because the data behind them is still moving. That's the only real difference between a list and a project.
Pick from either listicle above, but run it through the same two questions first. Can it be explained in two sentences to someone with no finance background? And would it hold up if questioned by an examiner who has read the exact same public data being cited? If both answers come back yes, the topic will likely survive the room a lot better than one of the fifty ideas copied from somewhere else.
References
This article draws upon insights from publicly available reports and publications, including the Press Information Bureau (Ministry of Finance), the India Brand Equity Foundation (IBEF), and Wert Finserve. These sources were referenced to provide context on India's digital payment ecosystem, ESG investing trends, sustainable finance initiatives, and evolving market developments.
The information has been used solely for informational and research purposes to support discussions on industry trends and investment perspectives. All analyses, interpretations, and conclusions presented in this article are original and have been independently developed for this blog.