
The Regional Manager of a retail chain walks into a Monday morning meeting with a sales report of the last quarter. Printed, fluorescently highlighted all over. The team debates for an hour. Decisions stall. What everyone failed to take into consideration is that the report is already three weeks out of date. By the time consensus is reached, the market has moved on.
This scenario is not uncommon. In many organizations that are still reliant on instinct and fragmented spreadsheets, it often reflects the operational baseline.
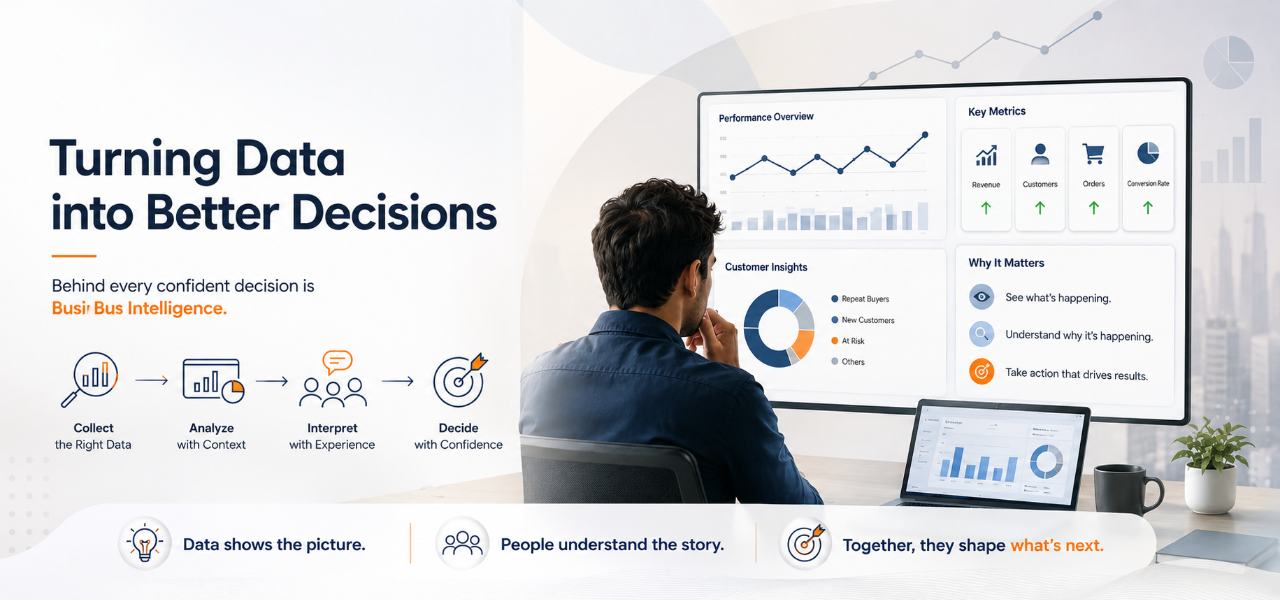
Business Intelligence changes that equation. BI transforms raw, scattered data into clear, actionable insight that arrives in time to support meaningful decisions. It connects what happened, what is happening now, and what is most likely to happen next.
Organizations that are leading today are not necessarily those with the most data, but those with the right tools, the right infrastructure, and a culture capable of acting on insights faster than their competition.
This blog explores how modern BI tools are reshaping decision-making, who is involved in those decisions, and what becomes possible when clarity replaces guesswork.
Business Intelligence Toolbox: What We Actually Use
Every vendor in this space will claim their product is a solution. However, a solution implies the problem is fully resolved. In reality, these are instruments, and like any instrument, the output is only as strong as the person operating it. Here is what the modern BI toolkit actually looks like, beyond the marketing narrative.
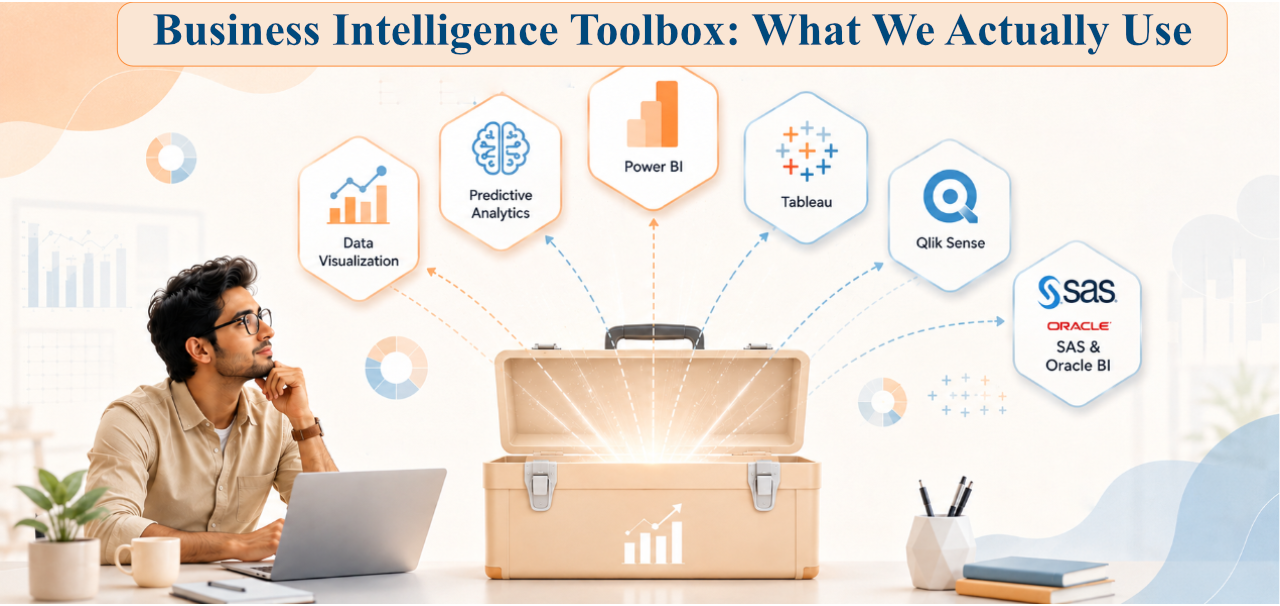
- Data Visualization: Raw data in its natural state is often overwhelming. Visualization tools convert thousands of rows into dashboards, charts, and maps that the human brain can interpret and act upon. It is not decoration. It is the mechanism through which patterns become visible and decisions become defensible.
- Predictive Analytics: This is where historical data meets forward-looking estimation. By applying AI and statistical models to past behavior, organizations can anticipate customer actions, market shifts, and operational risks before they materialize. It is not guesswork. It is probability-informed forecasting.
- Microsoft Power BI: One of the most widely adopted BI tools in the market, largely because it integrates seamlessly with the Microsoft ecosystem that many organizations already rely on. It is accessible for beginners but requires strong governance and architecture as it scales across enterprise environments.
- Tableau: Widely regarded as a benchmark for data visualization. Tableau produces highly refined and intuitive visual outputs, though it requires meaningful investment in learning before its full potential is realized.
- Qlik Sense: Built around an associative engine that approaches data differently from traditional query-based tools. Where others reflect what you explicitly search for, Qlik reveals connections you may not have initially considered, making it particularly useful for exploratory analysis.
- The Old Guard (SAS & Oracle BI): These platforms have maintained their position in enterprise environments for decades. They are designed for scale, complexity, and industries where data integrity, compliance, and stability are critical. They may not be the most visually modern tools, but they remain highly reliable in mission-critical environments.
What is Self-Service BI?
The promise is compelling. Business users build their own reports, explore their own data, and stop waiting on IT to generate every insight. It sounds like democratisation. In practice, it is only as powerful as the people using it.
When someone without a strong understanding of data structure and context starts concluding a self-built report, the result is not empowerment. It is confident misinformation. The numbers look right. The charts are clean. And the decision based on them is completely wrong. Self-service BI works brilliantly in the right hands. In the wrong ones, it accelerates bad decisions.
The goal should not be to give everyone access to data. It should be to give the right people the right level of access, paired with the literacy to use it responsibly.
- Integrated Solutions: A BI tool that cannot connect to the systems feeding it is just a window with no view. When your BI platform communicates with your CRM, ERP, and operational databases, you get a single, coherent picture of your business. Without that integration, every team is working from a different version of the truth, and none of them is fully right.
The Humans Behind the Dashboards
Technology does not make decisions. People do.
Behind every dashboard is an analyst whose job is far more complex than pulling numbers. They interpret trends, track performance metrics, translate technical findings into language stakeholders can act on, and often find themselves mediating disagreements about what the data is actually saying.
That last part is where it gets difficult. Data can be read in multiple ways, and organizational politics have a habit of influencing which interpretation wins. A skilled BI analyst does not just understand the numbers. They understand the people around the table and know how to build consensus around what the evidence is genuinely pointing to.
No dashboard, however well designed, asks the question "why." That still requires a human being.
The Value of Business Intelligence
Accuracy: Decisions grounded in data carry far less risk than those built on assumptions. When leadership can see a clear, evidence-based picture of performance, the margin for costly errors shrinks significantly.
Efficiency: BI makes waste visible. Bottlenecks that would otherwise go unnoticed for months surface quickly when the right metrics are being tracked. Resources get directed where they actually produce results.
Customer Intelligence: Customer data is not just a record of what happened. It is a map of behavior, preference, and intent. Organizations that read it well can design products, services, and experiences that meet demand before customers have to ask.
Competitive Relevance: While competitors are still debating last quarter, BI-driven organizations are already responding to what is happening now. That gap in timing is often the difference between leading a market and catching up to it.
The Implementation Nightmare
Implementing Business Intelligence is often more complex than it appears. A common issue is data silos, where marketing, finance, and other departments maintain inconsistent datasets, leading to multiple versions of the truth and fragmented decision-making.
Security and privacy add another layer of complexity. These are not optional features but essential components of BI systems, especially under regulations such as GDPR or HIPAA.
Another challenge is the skill gap. Even advanced BI tools deliver limited value if users cannot interpret and apply insights effectively, making training and data literacy critical for success.
However, the most persistent challenge is resistance to change.
Often described as “change management,” this reflects the human side of adoption. People are often reluctant to alter established workflows or trust systems that challenge existing intuition, making organizational alignment as important as the technology itself.
Success Stories: Proof This Actually Works
The effectiveness of Business Intelligence is well-documented across industries.
- Starbucks: BI is used to analyze purchasing behavior and customer preferences, enabling more personalized recommendations through its digital platforms.
- Amazon: BI plays a central role in logistics and inventory management, supporting demand forecasting and efficient distribution across global warehouses.
- Coca-Cola: The company applies data-driven insights to optimize its supply chain and refine marketing strategies at scale.
- Cleveland Clinic: In healthcare, BI is used to monitor patient outcomes and improve operational efficiency, contributing to more informed clinical and administrative decision-making.
Conclusion
By 2026, AI will no longer be an add-on feature in business intelligence; it will be the underlying engine. From automated optimization to real-time budget allocation and predictive customer value modelling, systems are increasingly capable of handling speed, scale, and complexity with minimal human intervention.
Yet, capability is not the same as meaning.
AI can surface patterns, detect shifts, and generate predictions, but interpretation remains a human responsibility. It cannot determine whether an insight aligns with organizational priorities, context, or intent.
The future of Business Intelligence is therefore not about perfecting data, but about achieving clarity. Organizations will rarely operate on flawless datasets, but they will operate on better, faster, and more connected ones than before.
In this environment, advantage belongs not to those who collect the most data, but to those who can translate it into decisions with confidence and context.